Knowledge
How to Choose Flatness Inspection Equipment: A Five-Step Reverse Method
The sentence heard most often in selection meetings is "how fine can this machine measure". It sounds professional, but it has the order backwards. A published specification describes a capability boundary under stated conditions, not whether that instrument will satisfy your requirement on your part. The question worth starting with is what you actually need.
This article gives a reverse method: five conditions, applied in order, each eliminating a slice of the field. What survives is usually a short list, and one far easier to get consensus on.
Step one: the tolerance band, not the instrument
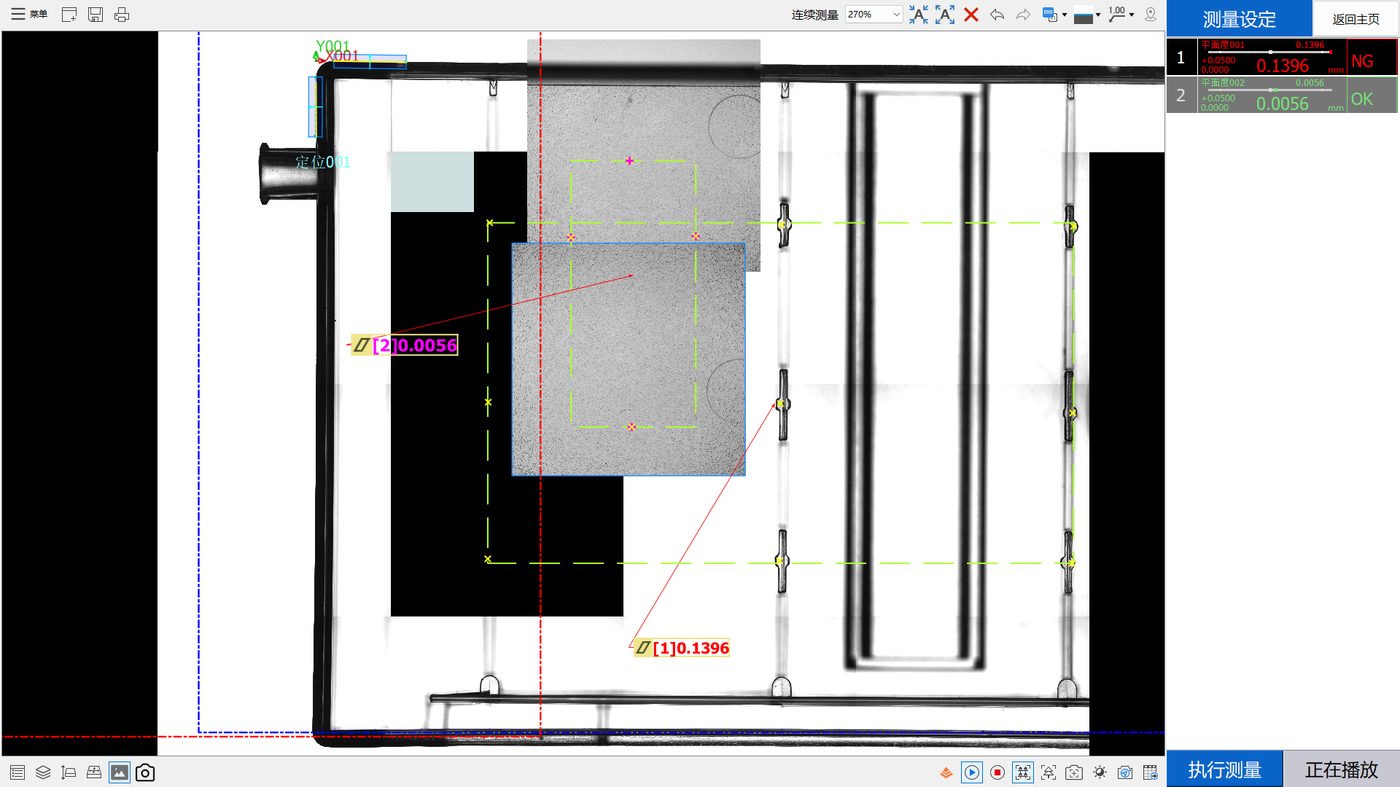
Note that equipment capability is rarely the bottleneck: for the integrated point-spectral confocal flash measurement setup used here, measurement accuracy reaches 2 μm. What has to be settled first is the tolerance band and how the zones will be evaluated - criterion first, instrument second. Reverse the order and it is easy to buy the wrong configuration.
The first number to settle is the tolerance value itself and the area it belongs to. The trap here is that the drawing may carry a part-wide flatness callout while the area people genuinely care about is local. Those two conditions can point at entirely different configurations.
In practice the measurement scheme should carry adequate margin against the tolerance of the zone rather than just meeting it, and the less mature the product or the noisier the process, the larger that margin should be. This is the general metrology principle of using a tenth to a quarter of the tolerance; the exact ratio depends on process capability and risk tolerance and should not be applied mechanically.
Do not skip "which area". In the case data behind this series, two zones on one part averaged more than twentyfold apart. Selecting equipment against a single part-wide tolerance under those conditions tends to end up wrong at both ends.
Step two: material and surface condition
Material determines which acquisition routes are available and which pitfalls to avoid. A quick classification:
| Material and surface | Main risk | Consider first |
|---|---|---|
| Soft plastic, thin walls | Probe force causes deflection | Non-contact methods |
| Transparent or semi-transparent | Transmitted light destroys the edge | Point spectral confocal, engineered illumination |
| Highly reflective metal | Local saturation, drifting edges | Low-angle illumination or confocal methods |
| Dark or low-contrast materials | Unstable image edge extraction | Enhanced illumination, specific sampling strategy |
| Rigid, insensitive to probe force | Cost | Contact remains viable |
Transparent plastics deserve a specific note. Conventional imaging relies on finding an intensity edge, and clear material lets the background through, so where the edge is becomes genuinely ambiguous. That usually means changing the illumination strategy - telecentric backlight for silhouette, for example - or switching to a method that does not depend on a 2D edge at all.
Step three: how many zones, and how dense
This step determines the shape of the configuration. Three questions: how many areas need independent scoring; how many points each area needs to be represented properly; and whether all of them can be reached in one clamping.
If zones are numerous and scattered, stage travel and motion strategy become the bottleneck. If point density is high but travel is modest, field of view and resolution become the focus. The POMEAS IMAGE 3 family illustrates the spread: IMAGE 3 has no XY stage, so its working range equals the lens field of view; PLUS, PRO and PRO-H extend coverage via a moving platform up to 300 x 200 x 75 mm; MAX and MAX2 use a high-precision dual-magnification system with smaller fields per shot and higher stated repeatability, and are the two models documented for height measurement.
Step four: cycle time and station layout
Cycle time is what separates a laboratory configuration from a production one. Allowing three minutes for a result and having fifteen seconds produce completely different configurations.
Establish: how many parts per day or shift require inspection; whether it is 100 percent inspection or sampling; the staffing at the inspection station; and how quickly results must return to the line. Those answers decide between single-point sequential measurement, parallel sensor heads, and integrated one-shot approaches.
One element is chronically overlooked: load and unload time. Very often the true bottleneck is placing, locating and removing the part rather than measuring it. Automating handling frequently buys more than doubling measurement speed.
Step five: how the data will be used
The last question determines the software layer: who consumes this data and for what. Is it inline judgement and sorting, quality record retention and traceability, or process analysis and improvement?
The three impose different demands on data completeness. Inline judgement needs nothing beyond OK/NG and the necessary alarm output. Traceability requires each result to be linked to a lot. Process analysis requires the underlying point data so events can be reconstructed later. Leaving this undefined during selection is how organisations end up with data that exists but cannot be used - verdicts retained without values, so nobody can reconstruct the scatter that was present.
Common misconfigurations
| Misconfiguration | Typical symptom | Consequence |
|---|---|---|
| Selecting against a global tolerance | Local requirements never listed individually | Configuration satisfies nobody; endless argument |
| Precision without range | Excellent headline figure | Cannot actually cover the part; areas left unmeasured |
| Ignoring handling time | Measuring itself is fast | Overall cycle still misses target |
| Verdicts without values | Report contains OK/NG only | No reconstruction possible; improvement loses its evidence base |
| Ignoring environmental conditions | Large temperature swing on site | Results not comparable across shifts |
What to send a supplier
To make the exchange productive, provide the following at enquiry stage: photographs of the real part with key areas marked; material and surface condition notes; the tolerance requirement per evaluation zone; target cycle time and shift output; the data format and retention you need; and site conditions including available space. The more complete this is, the closer the first proposal lands and the higher the pass rate in sample testing.
Frequently asked questions
Equipment first or scheme first?
Scheme first. The scheme comprises zones, sampling strategy, fitting rule and verdict basis, and those determine what capability is required. Equipment is merely how the scheme gets implemented. Working the other way regularly ends with hardware that forces you to rewrite process requirements to suit it.
Are accuracy and resolution the same thing?
No. Resolution usually refers to the smallest increment displayed or resolved, repeatability to agreement between repeated readings, and accuracy to closeness to true value. They do not substitute for one another; check each separately and understand the conditions under which each was determined.
Does a tight tolerance automatically mean it is hard to measure?
Not necessarily. Difficulty depends on the tolerance relative to the width of process variation, and on the size of the zone and how many points are needed to represent it. Holding a very tight flatness over a large area is generally harder than holding the same figure over a small one.
How different are inline and offline configurations?
Usually substantially. Inline demands cycle time, stability and environmental robustness, and needs synchronisation, triggering and reject interfaces. Offline permits relaxed timing and better environmental control. Software requirements diverge too, since inline solutions usually have to talk to production systems.
Is sample testing necessary before purchase?
Strongly recommended. A specification sheet narrows candidates; only measurement on your actual parts establishes whether the requirement is met repeatably. Send good parts, borderline parts and an explicit acceptance criterion, otherwise the trial cannot support a decision.
What should I protect first when budget is tight?
Protect the soundness of the evaluation scheme rather than the top specification on the hardware. A clearly defined scheme on a mid-range configuration generally outperforms an expensive instrument operating under unclear rules. If the evaluation is wrong, better hardware only delivers the wrong answer more consistently.
Related reading
Working principles and boundaries for each route are compared elsewhere; transparent parts and multi-point versus single-point trade-offs each have dedicated coverage.
Related products and configuration notes
- POMEAS MX Automatic Vision Measuring Machine - Structure options and higher-grade platform variants for wider coverage needs
- POMEAS IMAGE 3 Instant Vision Measuring System - Up to 300 features and 100 objects in one program, well suited to multi-zone evaluation
- SFS-D606 compact chromatic confocal sensor - 20 mm by 110 mm body at roughly 73 g for dense array layouts
- 20 kHz multi-channel confocal controller - 4 / 8 / 12 / 16 head configurations when more sensing points are needed later
Related reading
- Transparent Plastic Part Flatness Inspection: What Two Data Sets Actually Show
- Two Flatness Zones, Two Opposite Verdicts on the Same Part
- Flatness Out of Tolerance: A Troubleshooting Path That Actually Works
- What Flatness Really Means, and What It Is Often Confused With
- Flatness Measurement Methods Compared: Plate, CMM, Vision, Confocal
- Repeatability Is Not Accuracy: Reading Range, Sigma and Cpk Honestly
- Point Spectral Confocal for Transparent Plastics: Benefits, Limits and Four Mistakes
- Multi-Point or Single-Point Flatness: Choosing How to Collect the Points
- Where Warpage in Injection Moulded Parts Comes From
- Turning Inspection Data into Decisions: Four Stages of Refinement
Equipment Covered by the Five Steps
These are the instruments referenced above, from one-shot stage to areal interferometer. Each specification line is quoted from that product's own data sheet.
- POMEAS IMAGE 3 Instant Vision Measuring System — one-shot stage: 18 × 18 mm to Ø100 mm fields, repeatability from ±0.25 µm depending on model
- POMEAS WLI100 3D White Light Interferometer — sub-0.2 nm vertical resolution over a 0–10 mm Z range for areal topography
- Single-Channel Confocal Displacement Sensor Controller — one measuring head, the entry configuration for single-point thickness and position
Comparing models side by side? check the white light interferometer specification.
Send the flatness tolerance, the part size and the material and we will say which of these instruments can hold it. Contact us with the drawing.

Subscribe to Our Newsletter
Simply enter your email to receive the latest news and insights from Pomeas. Stay connected with Pomeas and be the first to discover new innovations in optical excellence.