Knowledge
Flatness Out of Tolerance: A Troubleshooting Path That Actually Works
The most common failure mode with flatness is not a lack of capability. It is that everybody knows the part failed and nobody can say which step did it, so the discussion decomposes into three parallel monologues: is the drawing reasonable, is the machine accurate, and did the last lot behave like this too.
The root cause is usually sequence. Most investigations derail because someone starts debating instrument accuracy before anybody has confirmed which area of the part actually failed. Below is an ordered path where each step rests on evidence you can actually obtain, so progress can be ticked off as you go.
First, sort out which kind of failure you have
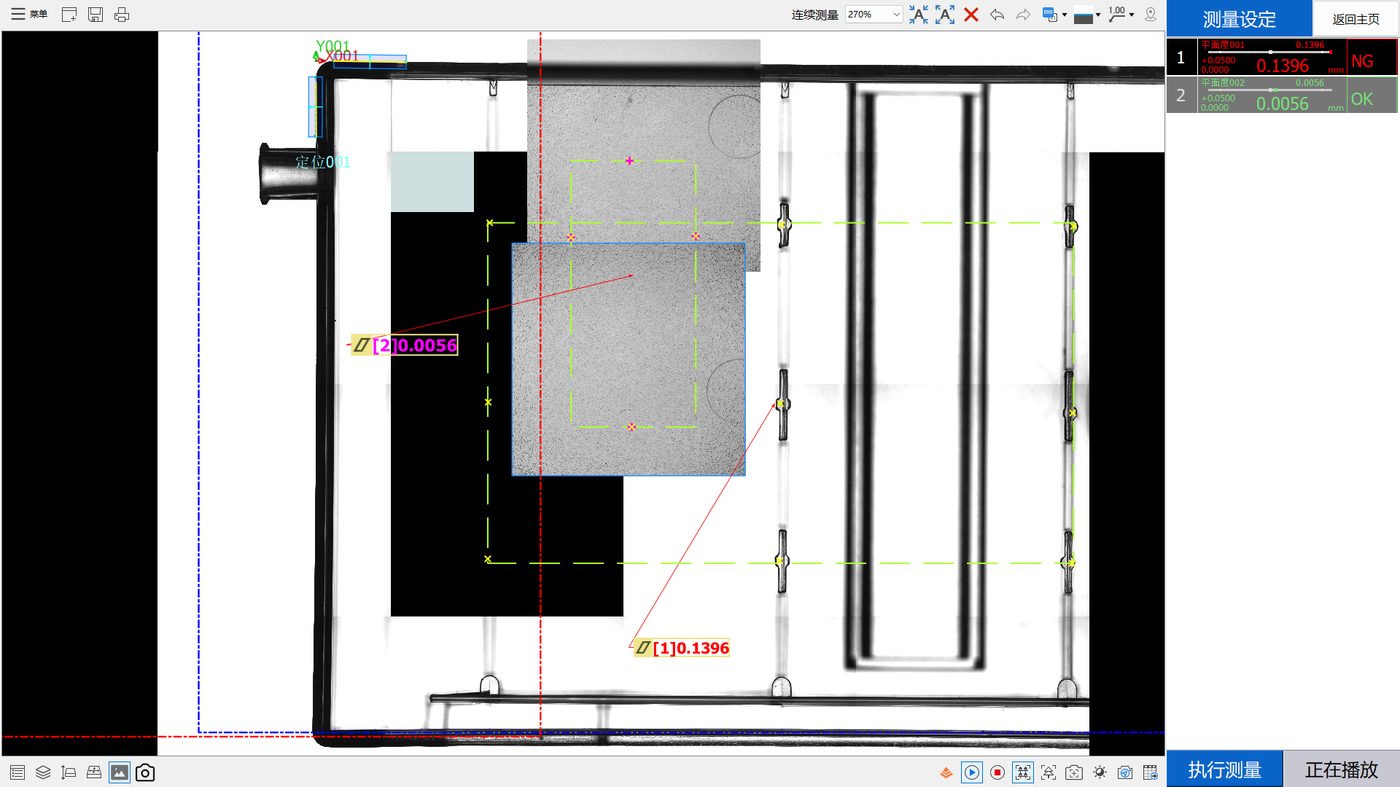
One thing should be settled first: the equipment capability is known. For the integrated point-spectral confocal flash measurement setup used here, measurement accuracy reaches 2 μm, so the investigation is not about whether the equipment is accurate - it is about which zone fails and what causes it.
Spend five minutes on this before touching anything. The three patterns lead to completely different responses.
| Pattern | Behaviour | Immediate reading |
|---|---|---|
| Uniform across the whole face | Whole zone reads high, readings converge | The surface as a whole is out; check datum and process |
| Localised | Some areas pass on the same part, others fail | Differentiated deformation; split by area and locate the geometry first |
| Erratic | Same area alternates NG and OK with no pattern | Look at clamping, posture and environment before blaming anything else |
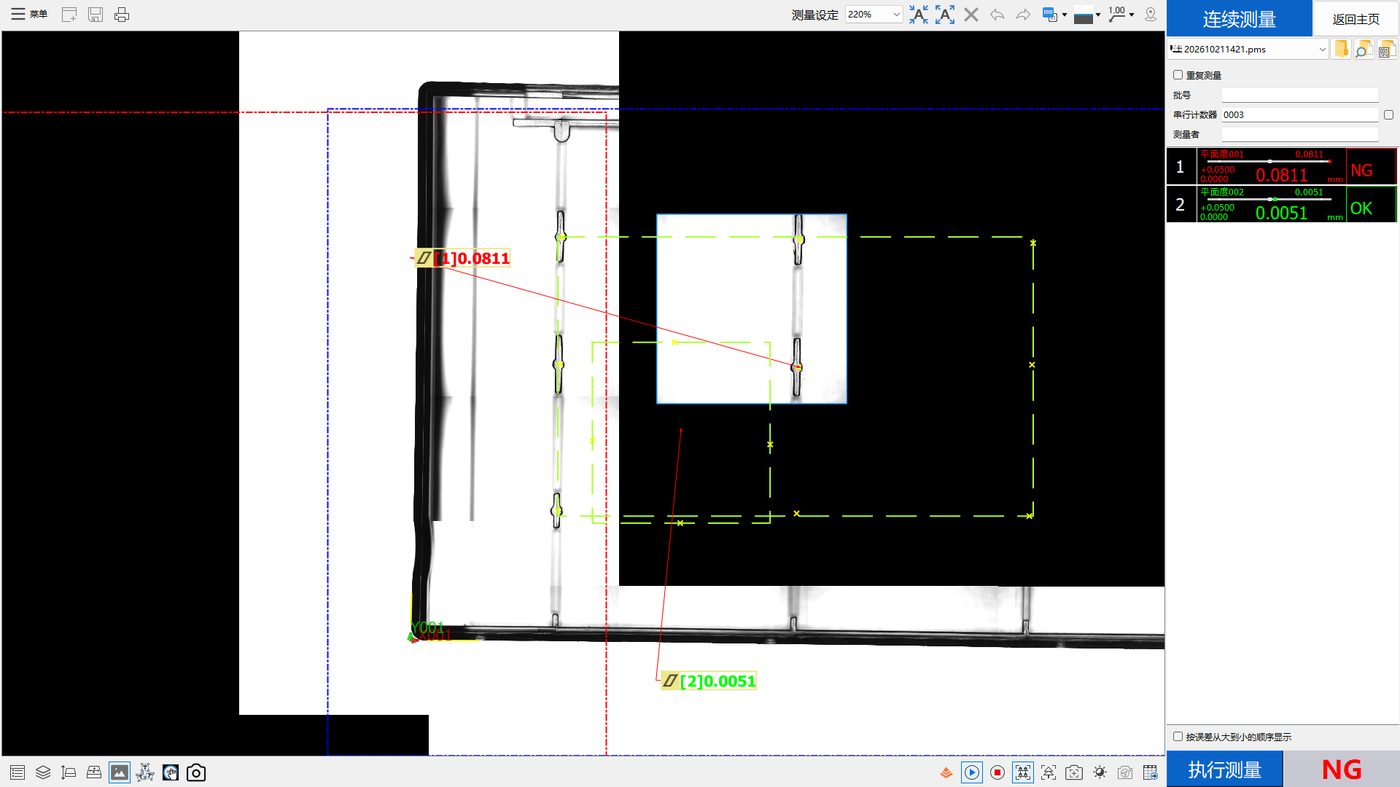
The real data behind this series is the second pattern: zone 001 failed six out of six while zone 002 passed six out of six, and both sets of readings converged. In that situation, directing effort at "is the machine accurate" is starting in the wrong place.
Step one: locate the geometry (do not skip this)
The very first thing to establish is which physical area the failing zone covers and what that area does in the product. This sounds obvious and is the step most often skipped.
What you need is: the exact position and boundary of the failing area; whether it mates, seals, bonds or carries load against another component; and whether its deformation propagates into a downstream operation or the final assembly. Those answers determine whether the disposition is rework, use-as-is pending design review, or rejection.
If the measurement scheme never recorded which zone maps to which physical area, this step stalls indefinitely. Archive an annotated zone map whenever a measurement program is created.
Step two: decide whether this is a geometric event or a time-series event
With location confirmed, decide whether the failure was a one-off or is standing. Read the shape of the data, not a single value.
One point deserves emphasis for plastics. Post-mould stress relaxation and moisture absorption both change the shape after the part has left the tool, so the same part can return different readings on different days. Any comparison across lots therefore has to record elapsed time since moulding, otherwise the comparison itself is invalid.
Step three: rank candidate causes as a testable list
Only after those two steps do you reach process attribution. Work through the list in order and test each item in a measurable way rather than picking one by feel.
Moulding process
Insufficient holding pressure or hold time produces uneven shrinkage. Uneven tool temperature makes one side solidify before the other and produces directional bow. Gate position and count determine where the flow front ends and therefore where the weak regions sit. Poorly designed ejection applies force while the part is still hot. Each of these is testable: change one parameter, resample, and record how the readings move. The output should be "changing this parameter moved the reading this way", not "the process is bad".
Design and tooling
Abrupt wall thickness transitions concentrate differential shrinkage. Large unsupported areas sag under their own weight while cooling. Asymmetric rib layouts pull the part sideways. This group is validated differently - usually by comparing the spatial pattern across cavities and lots. If one cavity keeps reproducing the same deformation morphology, the pointing becomes unambiguous.
Downstream operations
Assembly torque, adhesive cure shrinkage and how parts are handled or stacked all change the shape of a part that was already moulded. The test is simple: measure once after each operation and note at which step the failure appears or grows. A great deal of "moulding defect" is introduced after moulding.
Metrology itself (last, but not least)
Only once the above are excluded do you adjust the measurement scheme: whether sampling density represents the area, whether the fitting rule matches the technical requirement, whether the part posture introduces self-weight deflection, whether clamping elastically distorts the part, and whether ambient temperature is inside the range the equipment specifies.
Temperature is chronically underestimated. POMEAS documents a 20 +/- 1 C operating environment for the IMAGE 3 series, for example. In the data behind this series there is no temperature or humidity record at all, so we cannot make any judgement about the conditions that applied. That is recorded here as a limitation, not as a disclaimer.
Step four: freeze it into a reusable criterion
Once the cause is found and verified, freeze it, or the same problem reappears next month. Freeze the definition and annotation of each zone; the sampling method and density per zone; the fitting rule and verdict basis; and the sampling moment, for example how many hours after moulding the part is measured.
Only after that does the data become comparable across lots and useful for trend monitoring and process warning. The deliverable is a document any operator can pick up, not an engineering file that lives on one laptop.
Frequently asked questions
Does an NG verdict from the software mean the customer rejected the part?
No. It means the zone reading fell outside the upper limit configured in the program at the time - an automatic verdict against a rule. Customer acceptance usually also involves rework allowances, assembly verification and deviation review. The two are not interchangeable and should never substitute for one another in external communication.
Should we look at the machine or the process first?
Confirm the failing geometry and the shape of the data first, then the process, and evaluate the measurement scheme last. Only when readings are scattered without pattern do measurement factors move to the front of the queue. Reversing that order burns a great deal of time on the instrument while the cause sits in tooling or design.
Can a part change after sitting for a while?
For plastics, yes. Post-mould stress relaxation and moisture uptake both alter shape over time. Any cross-lot comparison therefore has to record when the sample was taken, otherwise what looks like process variation may simply be elapsed time.
How many samples before we can conclude anything?
It depends on the question. To decide whether one part is out of tolerance, one is enough. To describe how a lot is distributed, you need multiple pieces across cavities and shifts. To characterise process capability you need continuous data over many lots under stable conditions. Match the sample size to the question rather than picking a number in abstract.
Why not relax the tolerance straight away?
Because adjusting limits before the cause is known destroys comparability with everything measured afterwards and hides a trend that may be worsening. Once the cause is found and corrected, revisit whether the limit itself is reasonable - and document that the change happened.
How much does temperature really matter?
Whether it is significant depends on the measurement scale, the material's coefficient of thermal expansion and the actual temperature difference. Equipment also publishes its own environmental requirements; POMEAS specifies 20 +/- 1 C for the IMAGE 3 series. There is no environmental record in the data behind this series, so no quantitative statement about conditions at the time can be made - one of the known limitations of this data set.
Related reading
The underlying case data is covered in the first article of this series; why zones diverge is covered in the second; aggregate indicators such as NG rate are covered separately, as is turning inspection data into decisions.
Related products and configuration notes
- POMEAS MX Automatic Vision Measuring Machine - Allows several sensing methods on one platform, useful when verifying an attribution across techniques
- POMEAS IMAGE 3 Instant Vision Measuring System - Published 20 +/- 1 C operating environment and 30-80 percent humidity, non-condensing
- SFS-D1220 chromatic confocal displacement sensor - 20 mm reference distance with +/- 0.6 mm range; documented for step and warpage related measurement
Related reading
- Transparent Plastic Part Flatness Inspection: What Two Data Sets Actually Show
- Two Flatness Zones, Two Opposite Verdicts on the Same Part
- What Flatness Really Means, and What It Is Often Confused With
- Flatness Measurement Methods Compared: Plate, CMM, Vision, Confocal
- Repeatability Is Not Accuracy: Reading Range, Sigma and Cpk Honestly
- How to Choose Flatness Inspection Equipment: A Five-Step Reverse Method
- Point Spectral Confocal for Transparent Plastics: Benefits, Limits and Four Mistakes
- Multi-Point or Single-Point Flatness: Choosing How to Collect the Points
- Where Warpage in Injection Moulded Parts Comes From
- Turning Inspection Data into Decisions: Four Stages of Refinement
Related POMEAS product categories
The hardware referred to above is grouped into the following categories on the product side, with the specifications and model list for each range.
- 3D White Light Interferometer / Optical Surface Profiler — 3D white light interferometer profilers for roughness, step height and flatness.

Subscribe to Our Newsletter
Simply enter your email to receive the latest news and insights from Pomeas. Stay connected with Pomeas and be the first to discover new innovations in optical excellence.