Knowledge
Repeatability Is Not Accuracy: Reading Range, Sigma and Cpk Honestly
Two sentences cause most of the long-term confusion in industrial measurement. The first: this machine has excellent repeatability, so the readings must be correct. The second: the software computed this Cpk, so that is our process capability. Both attribute to an indicator something it does not express.
This article uses real data to show where each indicator stops. The data is deliberately modest - two flatness zones per part, six repeats each - which makes it well suited to demonstrating what a small sample can and cannot say.
Repeatability answers "is it stable"
Repeatability describes agreement between repeated measurements of the same quantity under the same conditions: same instrument, same program, same operator, same part, and a short elapsed time.
The direct test is scatter between repeats, quantified two ways. Range - maximum minus minimum - is intuitive but uses only two points. Standard deviation uses all of them and describes overall dispersion better, though it is equally sensitive to outliers.
What repeatability looks like in practice
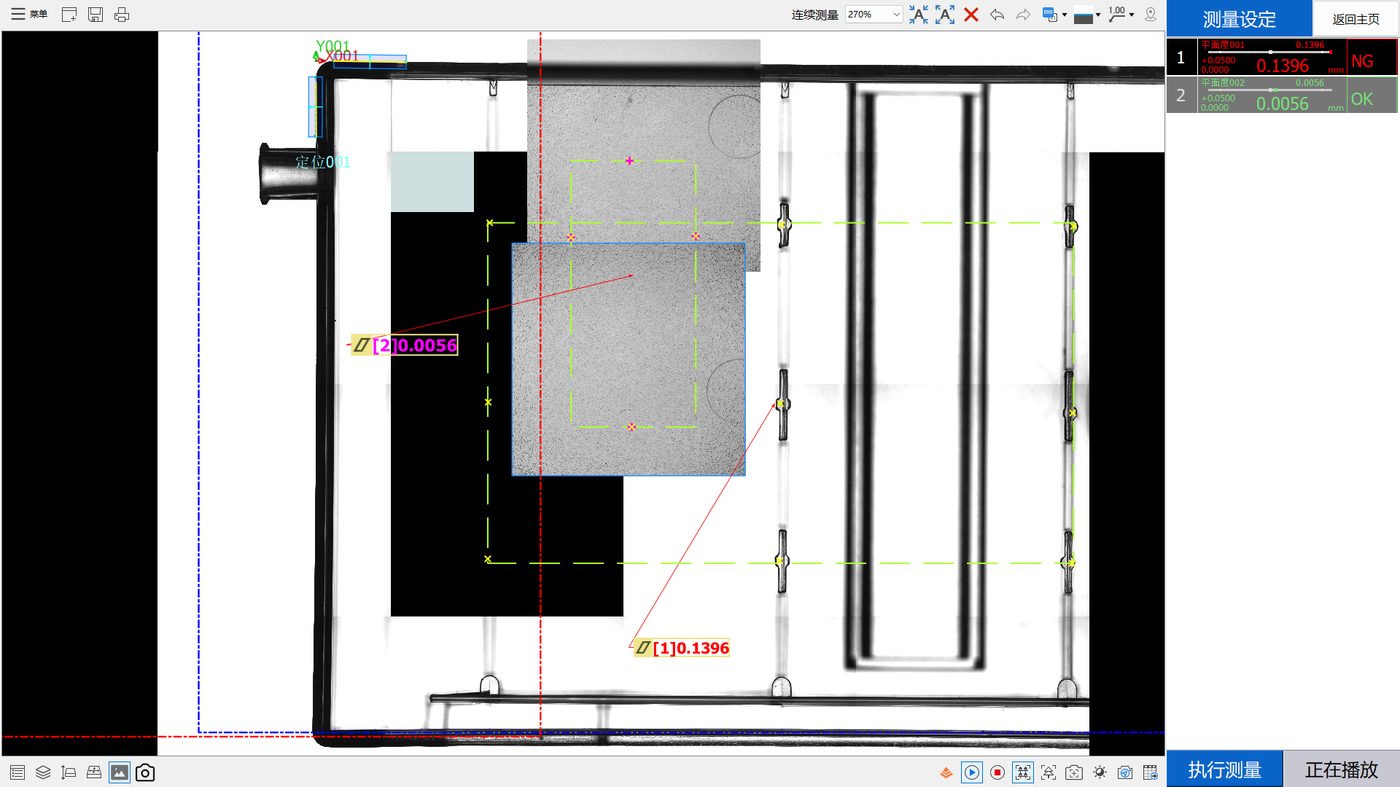
The table below gives the repeatability-related statistics for both runs, in millimetres, taken verbatim from the statistics region of the files.
| Run and zone | Mean | Range | Standard deviation | 6 sigma | Cpk |
|---|---|---|---|---|---|
| Right, zone 001 | 0.1403 | 0.0088 | 0.003156 | 0.018937 | -9.532584 |
| Right, zone 002 | 0.0060 | 0.0017 | 0.000588 | 0.003528 | 24.949094 |
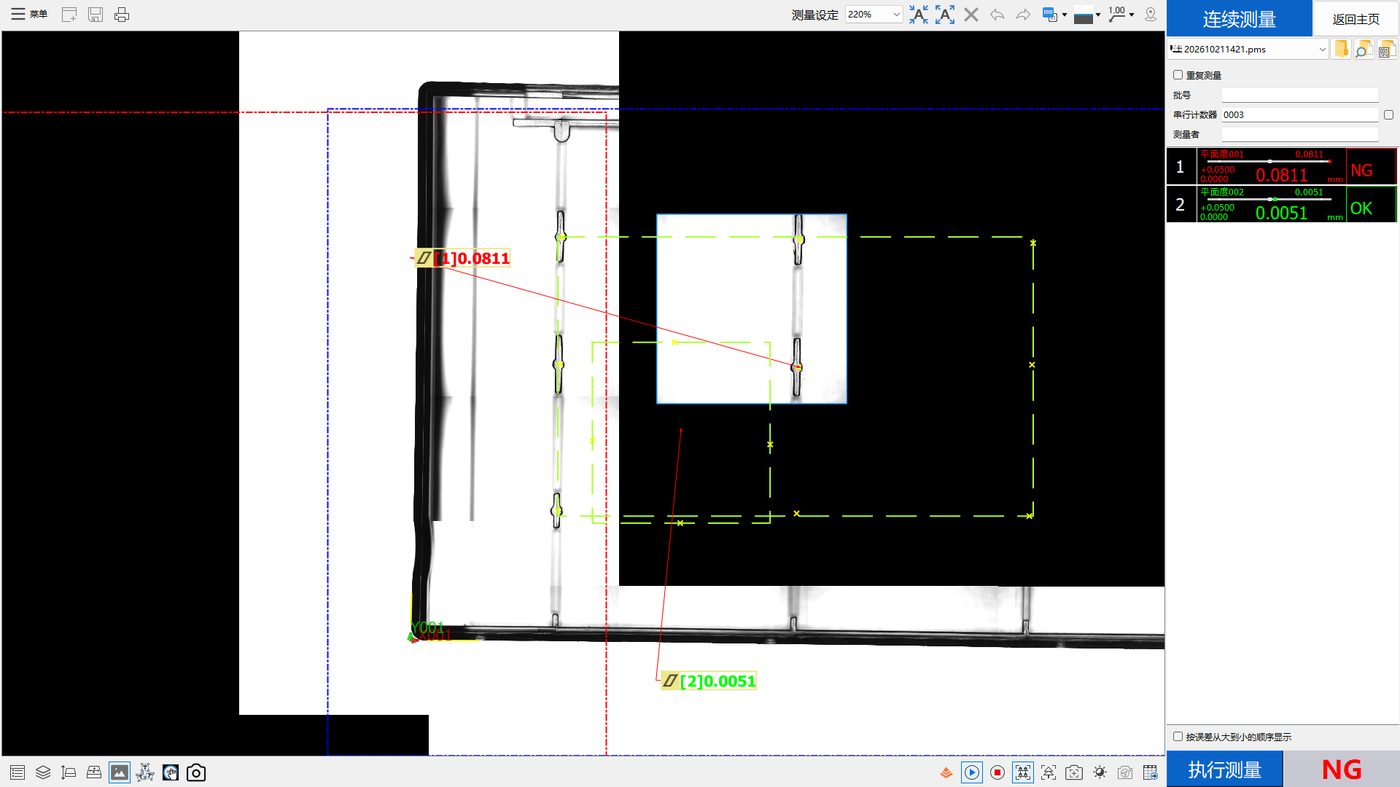
| Left, zone 001 | 0.0852 | 0.006 | 0.004022 | 0.024129 | -2.784232 |
| Left, zone 002 | 0.0045 | 0.0014 | 0.000456 | 0.002739 | 33.262189 |
At absolute scale, zone 001 spans 0.0088 mm on the right part and 0.006 mm on the left, while zone 002 is tighter still. Relative to their own means, neither spread is large. The readings converge, which is to say the setup returns consistent answers for the same area under the same conditions.
Accuracy answers "is it right"
Accuracy describes closeness to the true value. Discussing it requires a traceable reference - normally a higher-grade artefact connected through an unbroken chain back to a national standard.
That difference is the crux. Repeatability can be checked on the shop floor, using the part itself, during a single commissioning session. Accuracy cannot; it has to come through calibration. A data set containing only measurements of workpieces, no matter how many repeats it holds, cannot answer whether correct, because it contains no reference value.
Why good scatter does not mean good accuracy
Consider a rule whose graduations were printed 1 percent long. Measure the same object with it ten times and you get ten very consistent readings - excellent repeatability - every one of them wrong by 1 percent. The reverse also occurs: readings centred on the true value but spread out, giving good accuracy with modest repeatability.
Applied to this data set: six readings agreeing with each other establishes that the acquisition is stable. How far those readings sit from truth is not something this file can tell us, because nothing in it provides a reference. Scatter we may discuss responsibly; equipment accuracy we may not infer from here at all.
The single most important sentence in this article: range, sigma and six sigma describe dispersion, not correctness. Reading them as accuracy indicators is the most common and most expensive misreading on the shop floor.
What Cpk means when the sample is six
Cp compares tolerance width against process spread and ignores how the process is centred. Cpk additionally accounts for how far the mean sits from the centre of the tolerance. Both rest on a precondition: the process distribution is stable and the sample represents it.
In this data each part is measured six times, all within one day, on one part type. Anything the software computes under those conditions should be read as arithmetic applied to that six-value set - not as a measure of process capability. The distinction is not pedantry. Reporting -9.532584 as process capability invalidates every decision that follows from it.
Worth noting too: negative Cpk is not mysterious. When the mean sits outside the upper specification limit, the term capturing distance from the mean to the nearest limit goes negative and the result follows. It flags the position of the mean, nothing more. It is neither an equipment fault nor a software anomaly, and it is not equivalent to an acceptance verdict.
Three practical recommendations
One, separate the two layers in writing. Any report should distinguish a statistic computed on this sample from an evaluation of process capability, rather than leaving the reader to guess which column holds which.
Two, treat repeated measurement as a routine activity whose purpose is stability monitoring, not proof of accuracy. A sudden widening of scatter on a familiar part is itself a valuable signal, pointing at clamping, environment or incoming variation.
Three, verify accuracy through calibration, not repetition. Periodic calibration, interim checks and artefact verification belong to the accuracy side. Running more repeats on workpieces belongs to the stability side. Both are needed and neither substitutes for the other.
Frequently asked questions
Should I look at sigma or at range?
Both. Range is intuitive and fast to judge on the floor, but it uses only the endpoints and one stray value moves it a long way. Standard deviation uses every point and carries more information, though outliers affect it too. A practical pattern is range for rapid screening and standard deviation for the record, keeping the raw values alongside both so anything can be rechecked.
How many repeats is appropriate?
It depends on the purpose. Five to ten usually reveals whether readings converge. Characterising process capability needs far more, spread across lots and shifts. The important discipline is not to answer a large-sample question with a small-sample dataset.
Why would software produce a negative Cpk?
When the zone mean lies outside the specification limit, the term representing distance from the mean to the nearest limit becomes negative, so the result is negative. That is arithmetic behaving normally. It describes where the mean sits, not equipment failure.
Is a strong repeatability figure sufficient?
No. Repeatability describes consistency of repeated results, which is one component of capability. Whether your task is met also depends on accuracy, measuring range, resolution, environmental robustness and the evaluation scheme itself. Select on the whole set.
How do I tell whether an outlier is driving the statistics?
Look at the individual lines, not just the summary. Mean and sigma are both pulled by extreme values. Go back to the detail rows, look for a reading that stands apart, and check whether anything changed at that moment - part change, re-clamping, or another operation. Find the reason before removing anything.
Is it acceptable to publish Cpk in an acceptance report?
Yes, provided the sample provenance and size are stated alongside it, and it is made explicit whether the figure is a statistic of that sample or an evaluation of process capability. Without that framing, downstream readers will misread it and it will distort release, rework and process decisions.
Related reading
The underlying case data appears in the first article of this series; why several zones should be evaluated separately is in the second; correct reading of NG rate is covered separately.
Related products and configuration notes
- POMEAS IMAGE 3 Instant Vision Measuring System - Documented repeatability up to +/- 0.25 micrometre depending on model
- SFS-D410 chromatic confocal sensor - Stated repeatability 12 nm with linearity error better than +/- 0.08 micrometre
Related reading
- Transparent Plastic Part Flatness Inspection: What Two Data Sets Actually Show
- Two Flatness Zones, Two Opposite Verdicts on the Same Part
- Flatness Out of Tolerance: A Troubleshooting Path That Actually Works
- What Flatness Really Means, and What It Is Often Confused With
- Flatness Measurement Methods Compared: Plate, CMM, Vision, Confocal
- How to Choose Flatness Inspection Equipment: A Five-Step Reverse Method
- Point Spectral Confocal for Transparent Plastics: Benefits, Limits and Four Mistakes
- Multi-Point or Single-Point Flatness: Choosing How to Collect the Points
- Where Warpage in Injection Moulded Parts Comes From
- Turning Inspection Data into Decisions: Four Stages of Refinement

Subscribe to Our Newsletter
Simply enter your email to receive the latest news and insights from Pomeas. Stay connected with Pomeas and be the first to discover new innovations in optical excellence.