Knowledge
Where Warpage in Injection Moulded Parts Comes From
"The flatness is no good" is a description, not a diagnosis. It may originate in differential shrinkage during moulding, in a wall thickness transition in the design, or in something that happened after moulding. The corrective actions for those three have almost nothing in common, and adjusting process parameters by feel is the slowest possible response.
This article separates the sources into processing, design and time-dependent effects, with the recognition method and verification path for each. The aim is not to enumerate every possible cause but to supply an order - what to check first, what follows - so investigations do not restart from zero every time.
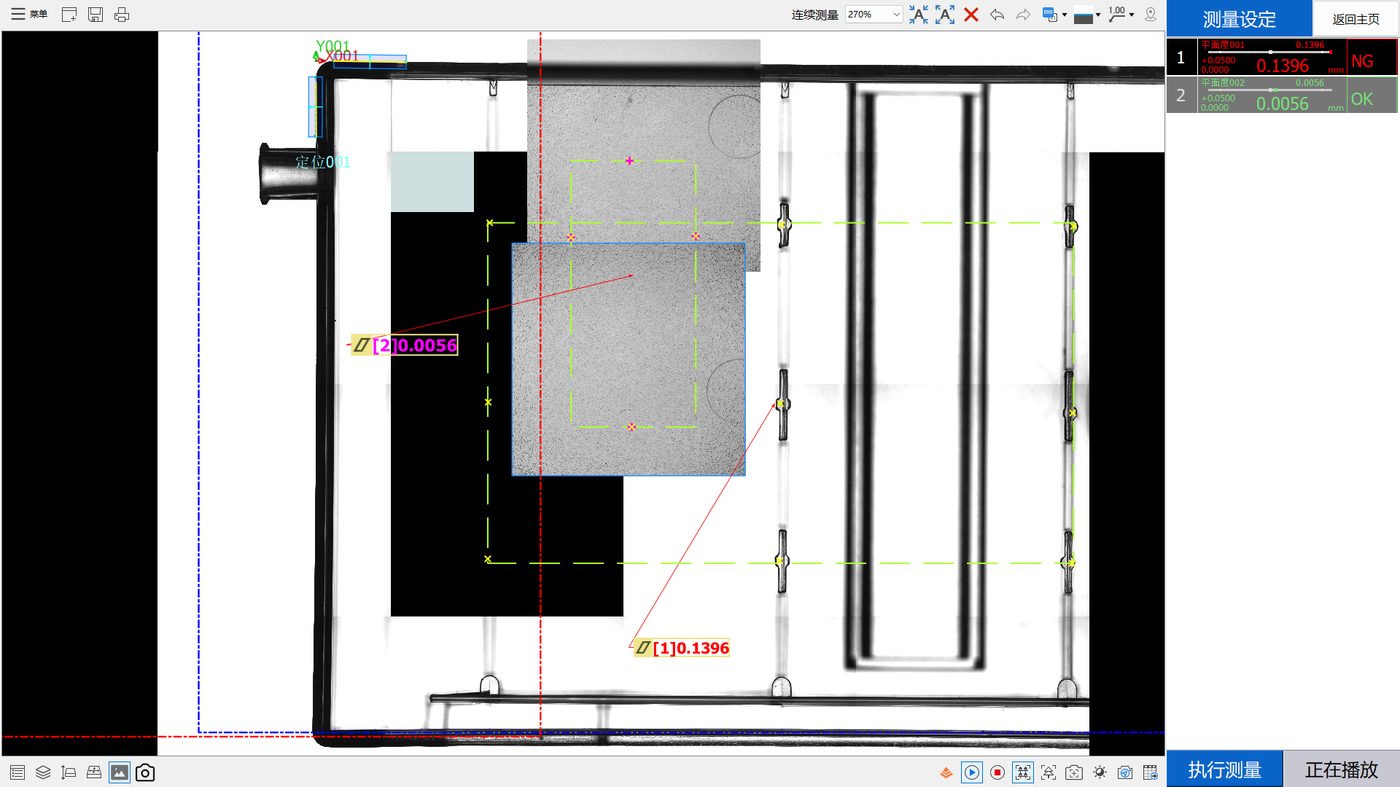
Line one: the moulding process
Plastic shrinks as it moves from melt to solid, and that shrinkage is rarely uniform in space. Any non-uniformity produces internal stress, and when that stress relieves you see departure from nominal geometry.
Holding pressure and time
Hold compensates for shrinkage. Too little pressure or too short a hold leaves regions far from the gate under-fed and visibly sunk. The usual recognition method is to look at part weight together with the morphology of any sink and whether it reproduces consistently per cavity.
Uneven tool temperature
Different temperatures either side of the tool mean different cooling rates. The side that solidifies first sets; the other keeps shrinking and pulls the part toward it. This class has pronounced directionality and usually correlates strongly with cavity position.
Gate location and count
The gate determines fill path and therefore where the flow front terminates and which regions are most likely to be short. Adding gates changes fill pattern but introduces weld lines. Gate changes are among the most effective levers and among the most expensive to carry out.
Ejection
Poor ejector layout or excessive ejector speed applies concentrated force while the part is still hot, producing local deformation or stress whitening. This tends to be easy to recognise because deformation maps onto ejector positions.
The basic verification method for processing causes is a single-variable trial: change one parameter, hold everything else, resample, compare distribution shape. Move three at once and even a good result tells you nothing you can use next time.
Line two: part design
When parameters are already in a sensible window and deformation persists, look at geometry.
| Design factor | Mechanism | Direction for improvement |
|---|---|---|
| Sudden wall thickness change | Thick and thin regions shrink at different rates, producing directional bow | Uniform or gradually transitioned walls |
| Large unsupported span | Self-weight plus cooling produces centre sag | Add support or revise layout |
| Asymmetric rib layout | Uneven stiffness pulls the part | Symmetrise or relocate ribs |
| Deep cavities or bosses | Concentrated ejection resistance and added strain | Adjust draft and ejection layout |
| Inserts or overmoulded features | Mismatched shrinkage between materials | Re-evaluate the concept or compensate in design |
This group verifies differently from processing causes. Process problems typically respond to parameter changes; geometry problems tend to show limited response to parameters while reproducing the same morphology across lots and machines. When several machines and several shifts all show the same deformation shape, geometry is considerably more likely than process.
Line three: time and environment
The shape of a moulded part is not locked at the instant it leaves the tool. A great deal of "passed yesterday, failed today" originates on the time axis rather than the process axis.
Stress relaxation
Molecular orientation and internal stress frozen in during moulding release gradually afterwards. Rate depends on temperature, but relaxation proceeds even at room temperature, just more slowly.
Moisture absorption and desorption
Several engineering plastics take up moisture measurably. A part stored at different humidity changes dimension with water content. The effect is reversible: uptake expands, drying shrinks.
Handling and stacking
Apparently trivial storage practice applies sustained load. Thin-walled parts stacked in layers, or hung badly, can change shape overnight. This accounts for a surprising share of morning failures.
Together these point to one operational conclusion: record the sampling moment and the storage conditions. Without them, readings taken by different people at different times cannot be compared, and observed differences cannot be attributed to either process or time. In the real data set behind this series the files carry no environmental or storage record, so no judgement about conditions can be made - a limitation that belongs in the report rather than in small print.
How to decide which line
A practical order follows. First, check consistency across cavities: if multiple cavities in one shot show the same morphology, look at geometry or the tool; if only one cavity misbehaves, look at that cavity's conditions or cooling. Second, check consistency across shifts and lots: if it appears only on one shift, look at operator practice or machine condition. Third, run a storage trial: measure parts from one batch at several elapsed times and see whether readings drift. Fourth, run single-variable process trials - but only once the earlier steps have excluded alternatives.
Those four steps locate the majority of flatness problems at a specific step. What remains usually is not a failure to find the cause but a situation where correction costs more than the benefit - at which point the tolerance requirement itself goes back to design for review.
Frequently asked questions
Why do cavities in the same shot differ so much?
Usually local differences in that cavity's conditions: blocked cooling producing local temperature excursion, worn gate, or poor venting. Measure temperature differences between cavities first, compare against whichever directional bias reproduces most reliably, then decide between tool repair and process adjustment.
Parameter adjustment only ever moves it slightly - what next?
Limited response to parameters combined with a morphology that reproduces across lots usually means the dominant cause is geometric rather than procedural. Collect multi-point data to confirm the shape, then feed it back to design for a review of wall thickness, ribbing and support.
Why do morning and afternoon readings differ?
Candidates include ongoing stress relaxation, dimension drift from temperature and humidity, and sustained load from however parts are stored. The remedy is standardisation: fix the sampling time, storage conditions and measurement environment, and record them as part of the work instruction.
Does annealing solve warpage?
Annealing accelerates stress release so the part stabilises sooner, but it moves deformation that would have happened later into now - it does not remove it. Whether it is worth an extra operation depends on functional requirements and downstream sequence, and on the added cost.
How do I know an improvement was real and not noise?
Sample size and sampling method decide this. Take enough pieces before and after, spanning cavities and time slots, and compare distribution shape rather than a single reading. Changing one part and reading it once carries almost no decision value.
Tool modification or process adjustment first?
Generally process first: cheaper, faster and reversible. Move to tool work only once process has been pushed to the edge of its reasonable window and the evidence points clearly at geometry. Back any tool change with complete data, otherwise it is easy to modify in the wrong direction.
Related reading
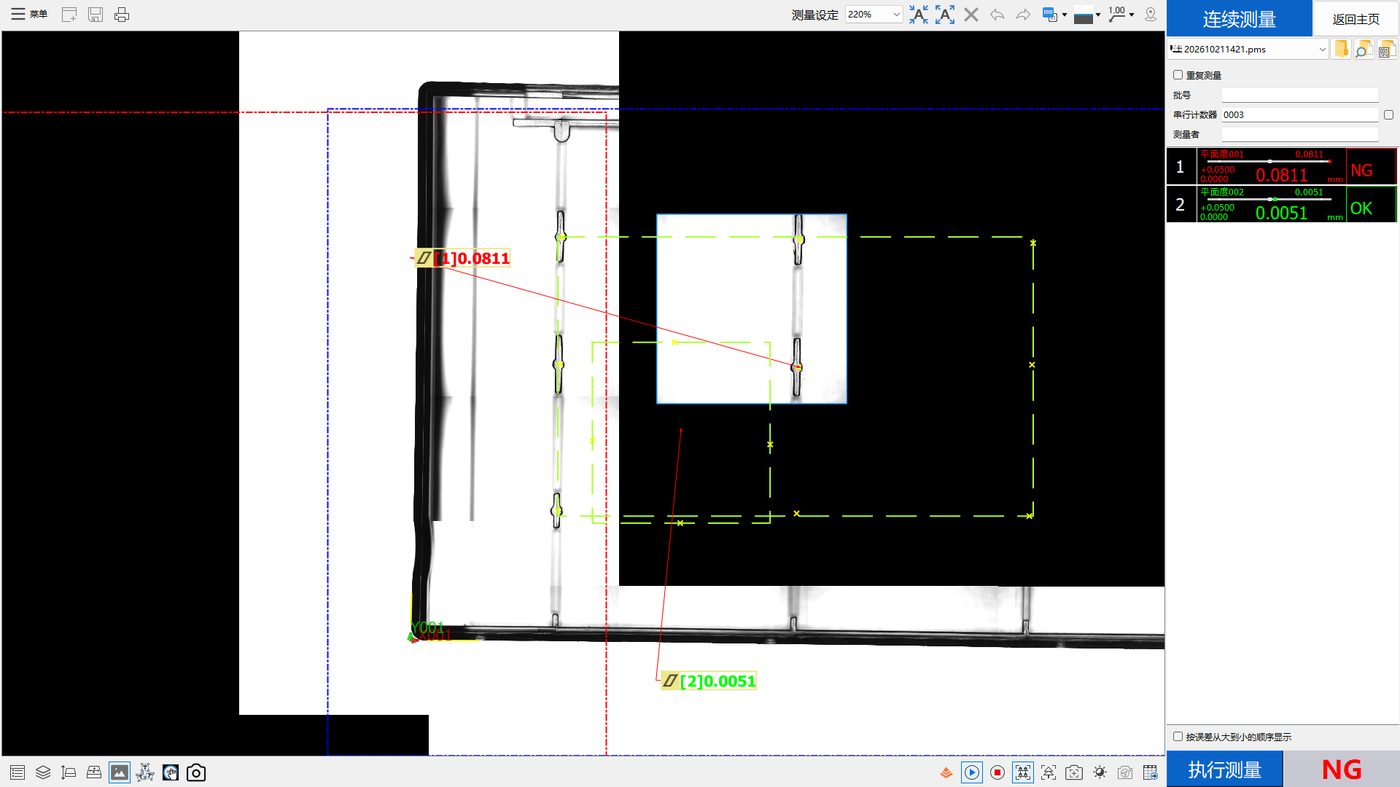
The systematic response after an out-of-tolerance result is covered in the troubleshooting article; how to interpret apparently contradictory zone verdicts has its own article.
Related products and configuration notes
- POMEAS MX Automatic Vision Measuring Machine - Lets several independently scored zones run on one platform for multi-point batch comparison
- POMEAS IMAGE 3 Instant Vision Measuring System - Multiple objects in one shot with several features per program, useful for multi-point sampling
Related reading
- Transparent Plastic Part Flatness Inspection: What Two Data Sets Actually Show
- Two Flatness Zones, Two Opposite Verdicts on the Same Part
- Flatness Out of Tolerance: A Troubleshooting Path That Actually Works
- What Flatness Really Means, and What It Is Often Confused With
- Flatness Measurement Methods Compared: Plate, CMM, Vision, Confocal
- Repeatability Is Not Accuracy: Reading Range, Sigma and Cpk Honestly
- How to Choose Flatness Inspection Equipment: A Five-Step Reverse Method
- Point Spectral Confocal for Transparent Plastics: Benefits, Limits and Four Mistakes
- Multi-Point or Single-Point Flatness: Choosing How to Collect the Points
- Turning Inspection Data into Decisions: Four Stages of Refinement
Related POMEAS product categories
The hardware referred to above is grouped into the following categories on the product side, with the specifications and model list for each range.
- 3D White Light Interferometer / Optical Surface Profiler — 3D white light interferometer profilers for roughness, step height and flatness.

Subscribe to Our Newsletter
Simply enter your email to receive the latest news and insights from Pomeas. Stay connected with Pomeas and be the first to discover new innovations in optical excellence.