Knowledge
Turning Inspection Data into Decisions: Four Stages of Refinement
Most plants do not lack data. Instruments produce results every day, reports pile up on the shared drive, and years of history can be retrieved. What is missing is the process that converts those numbers into what to do next. The result is predictable: ever more data, and decisions still made on experience.
This article splits that conversion into four stages, each with a defined output and acceptance test. The stages cannot be skipped. Trying to jump straight from a pile of raw readings to "should we change the process" usually stalls somewhere in the middle.
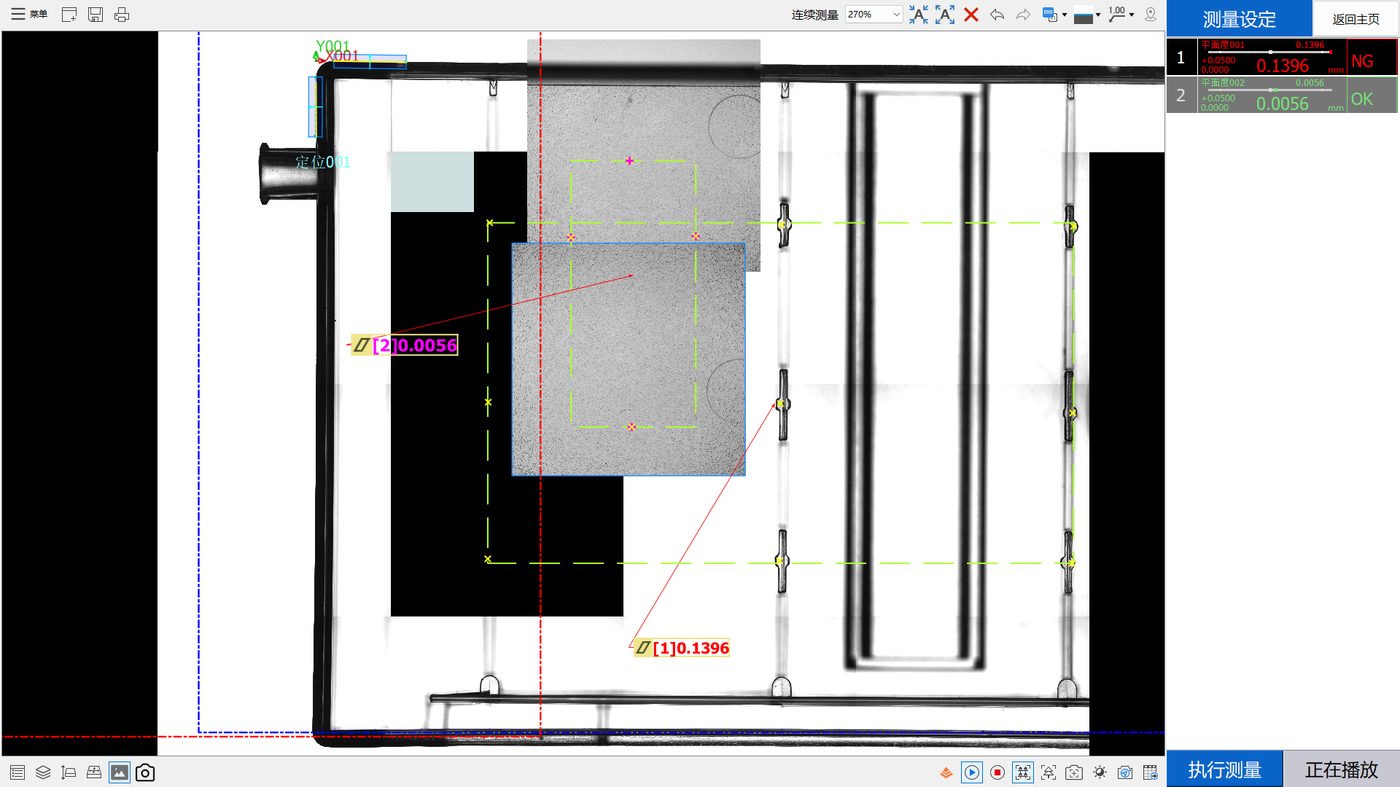
Stage one: completeness of the raw readings
The output here is a raw record that can be rechecked. It must contain the actual values from every measurement, not merely OK or NG.
Why insist on values? Consider a zone hypothetically reading 0.048 mm against a 0.05 mm limit - this figure is used purely for illustration and is not a reading from the inspection data set discussed here. The verdict is OK. But that OK does not mean the same thing as the OK recorded at 0.005 mm: the first sits close to the limit and can change status at any time, the second carries ample margin. Store only OK/NG and that distinction disappears permanently, along with any chance of trend warning.
Two failure modes dominate this stage. The first is storing verdicts without values. The second, just as damaging, is storing values without linking them to lot, time, cavity or operator - numbers without context cannot support attribution analysis.
| Field | Why it is needed |
|---|---|
| Value per evaluation zone | Trend analysis and rechecking |
| Verdict, OK or NG | Fast response on the floor |
| Timestamp | Time series analysis |
| Lot and cavity number | Cross-cavity consistency analysis |
| Product and operation step | Locating the problem across the process |
| Sampling moment relative to moulding or upstream step | Removing time-dependent effects |
| Equipment and program identifier | Traceability and version control |
Stage two: extracting statistics
With raw values in place, compress them into manageable statistics: mean, range, standard deviation and sample count per zone. The core activity here is stratification. Averaging everything together regardless of origin smooths away exactly the differences between lots and cavities that matter.
How you stratify follows from the question. Looking at quality over time means stratifying by time; cavity consistency means stratifying by cavity; shift differences mean stratifying by shift. The same data stratified differently frequently shows entirely different things.
One boundary needs stating. Mean, range and standard deviation describe central tendency and dispersion. They support finding anomalies and watching trends, but they are not process capability evaluation. We treat that distinction at length elsewhere: a capability index computed on a small sample can only be read as a statistic of that sample.
Stage three: visualisation and anomaly detection
The output here is a chart whose anomaly you can see at a glance, built for daily review rather than for formal reporting. Three types earn their place: trend charts showing mean drift and changing scatter over time; stratified box plots comparing distributions across cavities or lots; and Pareto charts of failure categories to locate the dominant nonconformance.
The most important property of visualisation is that people are willing to look at it. A chart that takes five minutes to interpret will not be read. Keep them simple, answer one question each, and mark anomalies conspicuously.
Anomaly rules belong at this stage too. What change triggers a response? The usual approach is statistical control limits with alarms on excursion. When setting them, separate a single point beyond limit from a continuous one-directional run - the latter more reliably indicates genuine process drift.
Stage four: closing the loop to action
The output here is a concrete action: who changes what, and when it is verified. Without this stage, the previous three are documentation.
A working loop has four elements: trigger condition for starting analysis; analysis ownership; disposition authority, meaning how much deviation can be handled on the floor and how much escalates; and verification timing, specifying how long afterwards and with how many samples effectiveness is confirmed. Miss any one and the loop breaks at that point.
A common misconception: treating data retention as the goal. Retention exists to support decisions. If a year passes without a single decision driven by that archive, then however complete the filing is, it is cost.
Getting started from one inspection record
If the current data setup is thin, do not rebuild everything at once. Pick one line and one characteristic and work through: define how it is evaluated, including zone, sampling and fitting rule; confirm the fields to record and configure them on the instrument; build one chart that updates daily; agree the anomaly response rule and name an owner; then, after one full cycle, ask honestly whether anyone actually used that chart.
Once one line works, replicating to other characteristics costs far less, and the experience from the first pass makes every subsequent rollout smoother.
Frequently asked questions
Store the values or just the verdict?
Both, with values given priority. Verdicts serve rapid floor response; values support trend analysis, investigation and improvement. Data carrying only OK and NG cannot support quantitative analysis and cannot be used to check whether the verdict boundary itself was sensible.
Where should the data live?
It depends on scale and existing systems. Structured files with disciplined naming work at small scale; once volume justifies it, move to a database or dedicated quality system linked to production lots. Whichever route, field definitions must be standardised and naming stable, otherwise nothing can ever be consolidated.
How often should trend charts be reviewed?
It follows from process stability and production pace. Unstable processes warrant daily review; stable ones can move to weekly, provided automatic limit alarms stay in place so nothing is discovered late.
How are control limits set?
Commonly from data taken during a historically stable period, recalculated periodically as the process improves. Keep control limits distinct from specification limits: control limits state what the process actually achieves, specification limits state what the customer requires. They are not interchangeable.
How do you keep analysis efficient at high data volume?
Automation, not manual trawling. Store structured at acquisition, generate reports automatically, flag anomalies automatically, and leave judgement and decision to people. Manual data handling always collapses once volume arrives.
How do I know the loop is genuinely running?
Two signals. Whether any improvement action has ever been triggered by the data, and whether the data actually moved afterwards. The first without the second suggests attribution is wrong; neither means the loop never started.
Related reading
Honest reading of scatter indicators is covered in the repeatability article; NG rate interpretation has its own article.
Related products and configuration notes
- POMEAS IMAGE 3 Instant Vision Measuring System - Generates per-part, statistical and spreadsheet reports for downstream analysis
- POMEAS MX Automatic Vision Measuring Machine - Program-driven batch workflows with consistent output for trend monitoring
Related reading
- Transparent Plastic Part Flatness Inspection: What Two Data Sets Actually Show
- Two Flatness Zones, Two Opposite Verdicts on the Same Part
- Flatness Out of Tolerance: A Troubleshooting Path That Actually Works
- What Flatness Really Means, and What It Is Often Confused With
- Flatness Measurement Methods Compared: Plate, CMM, Vision, Confocal
- Repeatability Is Not Accuracy: Reading Range, Sigma and Cpk Honestly
- How to Choose Flatness Inspection Equipment: A Five-Step Reverse Method
- Point Spectral Confocal for Transparent Plastics: Benefits, Limits and Four Mistakes
- Multi-Point or Single-Point Flatness: Choosing How to Collect the Points
- Where Warpage in Injection Moulded Parts Comes From

Subscribe to Our Newsletter
Simply enter your email to receive the latest news and insights from Pomeas. Stay connected with Pomeas and be the first to discover new innovations in optical excellence.