Knowledge
What a 100 Percent NG Rate Means - and What It Does Not
NG rate looks like the clearest number on a report and is in practice the most over-interpreted. It gives a ratio, and from that ratio people readily derive "this lot is no good", "the customer will reject it", or "something is wrong with the machine". None of those conclusions is carried by the NG rate itself.
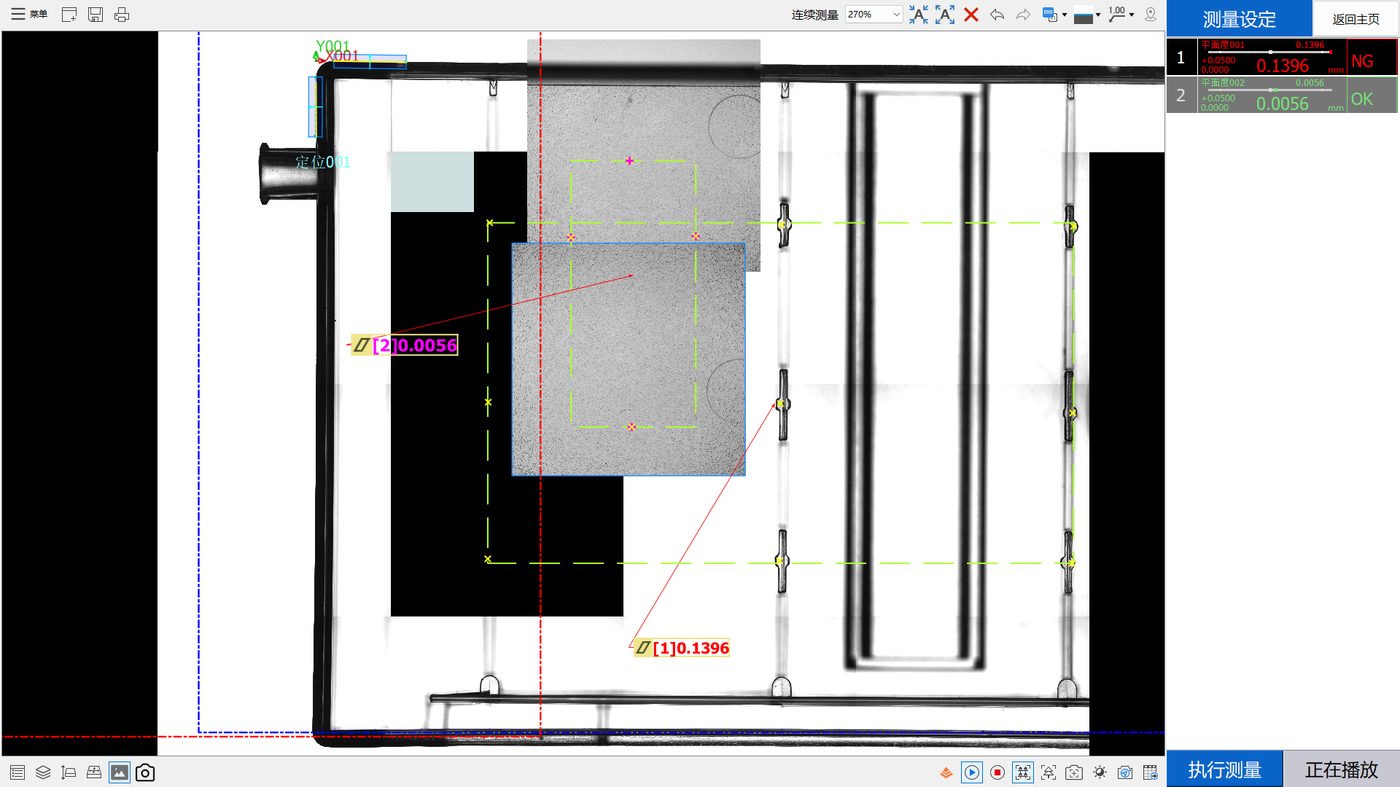
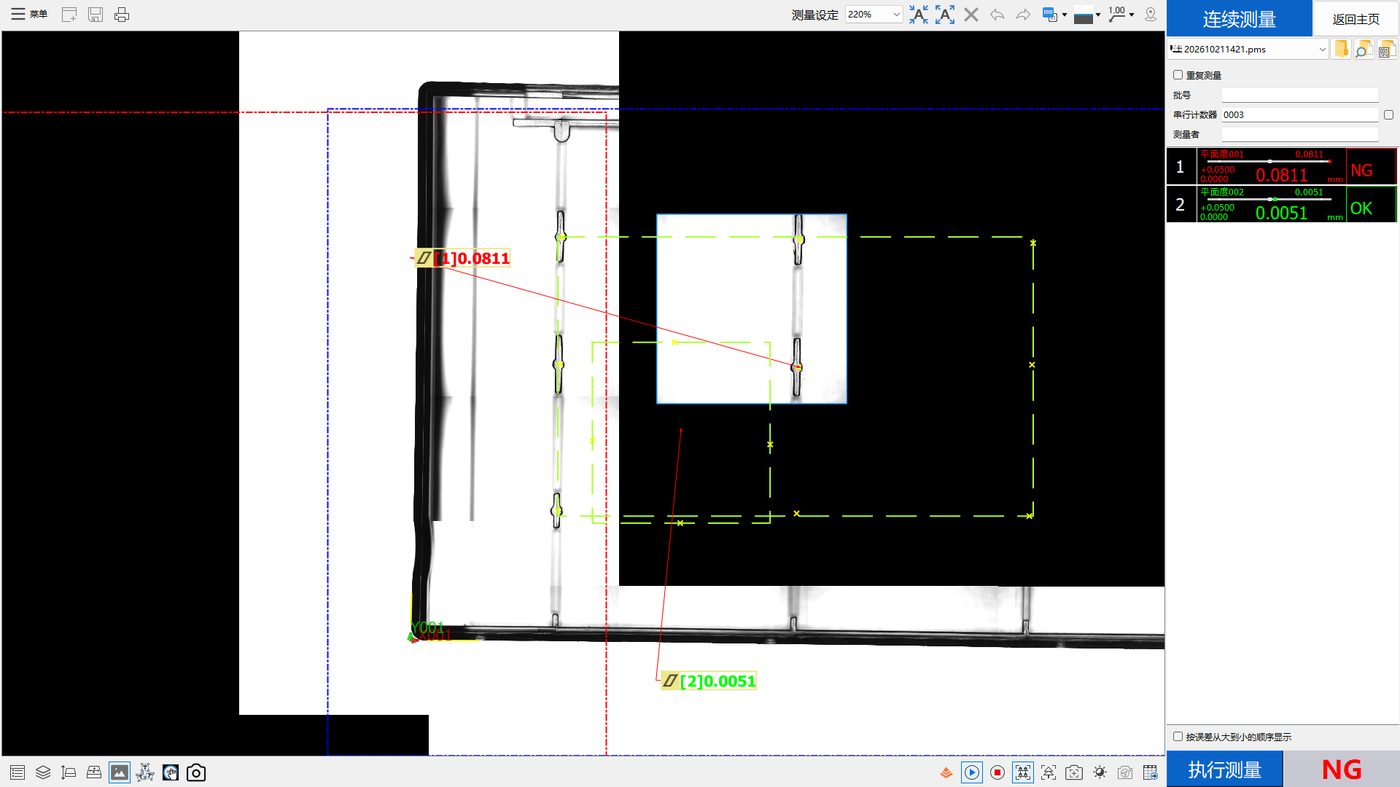
This article works through that using real data. In it, zone 001 on both runs failed six cycles out of six - NG rate recorded as 1.0000 - while zone 002 on the same parts passed six out of six, an NG rate of 0. Extremes at both ends inside one data set make it a good vehicle for asking what a high NG rate can establish.
Check the denominator first
The first reaction to any NG rate should be to establish the denominator, the total number of valid measurements it divides by. Here that number is 6. So NG rate 1.0000 means precisely this: across these six automatic cycles, readings for that zone exceeded the upper limit configured in the software every time.
What is six? It is a typical sample size for commissioning or verification, adequate for asking whether readings converge and nowhere near adequate to describe a lot, a day of production or a month of process behaviour. An NG rate over six is not "this lot is 100 percent defective" - it is not even the quantity the word defect rate normally refers to.
Three things it does establish
One: on this small set, the readings sit outside the limit, and not marginally. Zone 001 averaged 0.1403 mm and 0.0852 mm against a configured upper limit of 0.05 mm - a large, unambiguous gap rather than a borderline wobble. Additional cycles would not be needed to establish whether the limit was exceeded.
Two: whatever the zone covers is worth attending to. Because the contrast is internal to the same clamping and the same program, with the other zone passing six out of six and running roughly twenty times smaller, a picture of chaotic measurement is effectively excluded. The contrast itself localises the issue to a specific area.
Three: the verdict logic is being applied consistently. The software scored against the configured limit and did so the same way every cycle, with no oscillating good-bad results within one zone. That is evidence the measurement scheme is functioning, which is itself useful.
Four things it does not establish
| Supported | Not supported |
|---|---|
| Readings exceed the configured upper limit | Equipment fault or measurement failure |
| Location of the affected area is relatively clear | Defect rate for the whole lot |
| Scoring was applied consistently | The customer's final acceptance decision |
| The readings themselves are unambiguous | Long-term capability or production Cpk |
It does not indicate a machine problem
Whether equipment is functioning is a question about scatter and error of indication, not about how much NG it issues. Here the readings within one zone converge - zone 001 spans 0.0088 mm on the right part and 0.006 mm on the left - so acquisition is stable in itself. Whether values are close to truth is a calibration and artefact question, entirely independent of NG rate.
It does not give a lot-level or shipping conclusion
Defect rate describes conforming output as a proportion of total production, so its denominator is production count, not cycles in a commissioning session. Reading a six-denominator NG rate as a defect rate is a category error. Equally, shipping disposition follows acceptance rules agreed with the customer, usually involving sampling plans, acceptance levels and deviation procedures, not a single internal report.
It does not substitute for customer acceptance
This is the point requiring most care. The software judges where readings sit relative to a configured limit. Customer acceptance may involve assembly verification, functional testing and deviation review. A whole process sits between them. So software NG must never be written as customer rejection - nor the reverse. Every statement in this series maintains that separation deliberately.
It cannot support long-term capability statements
The files also carry Cpk values, -9.532584 and -2.784232, computed automatically across six samples. At that sample size, Cpk characterises the sample set only and carries no process capability meaning. If it appears in a report, sample provenance and size must appear next to it, or it will be misread downstream.
How to write a responsible report
Combining all of the above, a report on a result like this should carry at least five elements: what the verdict basis was, meaning which limit and where it came from; what the denominator was, meaning valid count and sampling scope; the comparison results from the same session, meaning which zones passed and which failed; the stated boundary of conclusions, meaning what cannot be inferred; and what is needed next to reach the following level of conclusion.
With those five present, the report cannot be read three different ways by three different people, and nothing needs to be patched up verbally afterwards. That is also the precondition for inspection data becoming an asset rather than an archive.
Frequently asked questions
Does a 100 percent NG rate mean the whole lot is unusable?
That cannot be concluded directly. Establish the denominator first - here it is six automatic cycles, not total output. Then establish which zone failed and what it does in the product. Finally consult the acceptance rules agreed with the customer. Only after those three checks can a disposition be formed.
Why do 100 percent and 0 percent appear in one report?
Because the zones address different areas and are scored independently. Here one area ran roughly twenty times the other under the same clamping. That is not a contradiction; it is direct evidence that this part cannot be described with one flatness value.
Can a software NG be written as customer rejection?
No. The software verdict states where a reading sits against a configured limit. Customer acceptance is a larger process including assembly verification, functional test and deviation review. The two should never substitute for one another in a formal record.
Is a negative Cpk normal in a report?
Yes. When the zone mean lies beyond the upper limit, the term for distance from mean to nearest limit becomes negative and the result follows. It reflects where the mean sits, not equipment failure, and not a software fault. Equally, it does not represent long-term process capability, so the report should state sample source and size alongside it.
Should we measure again?
It depends on intent. To establish whether the limit really was exceeded - no need; here the readings sit far past the limit and converge cycle to cycle, so repeating would not change anything. To understand distribution shape or stability, what is needed is a larger and more representative sample, not simply another six cycles of the same thing.
What data should follow?
Three directions. Broaden the sample across lots, cavities and shifts. Attach context, meaning sampling moment, environmental conditions and the process parameters in force. And settle intent, meaning product and process engineering confirming the failing area's function and acceptable limit. With those three in hand, discussion can move from "it failed" to "here is what we do".
Related reading
The underlying case data is in the first article of this series; why zones diverge is in the second; the follow-up sequence has its own article, as does organising data into decisions.
Related products and configuration notes
- POMEAS MX Automatic Vision Measuring Machine - Supports several independently scored zones so a report can carry internal comparison
- POMEAS IMAGE 3 Instant Vision Measuring System - Records per-feature results and exports reports including statistical summaries
Related reading
- Transparent Plastic Part Flatness Inspection: What Two Data Sets Actually Show
- Two Flatness Zones, Two Opposite Verdicts on the Same Part
- Flatness Out of Tolerance: A Troubleshooting Path That Actually Works
- What Flatness Really Means, and What It Is Often Confused With
- Flatness Measurement Methods Compared: Plate, CMM, Vision, Confocal
- Repeatability Is Not Accuracy: Reading Range, Sigma and Cpk Honestly
- How to Choose Flatness Inspection Equipment: A Five-Step Reverse Method
- Point Spectral Confocal for Transparent Plastics: Benefits, Limits and Four Mistakes
- Multi-Point or Single-Point Flatness: Choosing How to Collect the Points
- Where Warpage in Injection Moulded Parts Comes From

Subscribe to Our Newsletter
Simply enter your email to receive the latest news and insights from Pomeas. Stay connected with Pomeas and be the first to discover new innovations in optical excellence.